US Areas With The Most Small Businesses [Data analysis]

Key Findings
- There are over 36 million small businesses in the US, 82.4% of which are solo operators with no employees.
- Small businesses employ over 62 million people, accounting for 45.9% of the country's employed workforce, and are responsible for over $3.4 trillion of annual payroll payments.
- Non-employer small businesses report income receipts of over $1.7 trillion, at an estimated value of $57,611 per non-employer business.
- Small businesses provide over $3.1 trillion of payroll to the 54.6 million employees located in metro areas alone, equivalent to $57,412 per employee.
- Small businesses in metro areas spend an average of 19.7% of their earnings on payroll. In comparison, large businesses (500+ employees) pay just 16.3%.
National small business statistics (2025)
The Small Business Administration estimates that 36,186,089 small businesses are operated across the U.S., of which almost 30 million (29,811,495) have no employees and are run solo or as independent contractors. Of the remainder, 5.7 million businesses have between 1 and 19 employees, and just over 654,000 businesses operate with between 20 and 499 employees.
In total, small businesses pay over $3.46 trillion dollars to a total of 62,250,556 employees and owners of small businesses. This equates to $55,663 per person on average at an individual level.
Small businesses account for 38.7% of total payroll nationwide. While this is a significant share, it is still less than the total payroll paid out by large firms, of which there are far fewer.
Small businesses at the state level
The spread of businesses isn’t evenly distributed, with just five states home to over two-fifths of small businesses (41.6%). California, the state with the most small businesses in the country, is home to over 11% of all small businesses and 14.4% of payroll generated by small firms.
Tennessee has the highest percentage of small businesses with no employees (86%). Montana is the polar opposite, with the highest percentage of small businesses with staff recorded as working for them (25%).
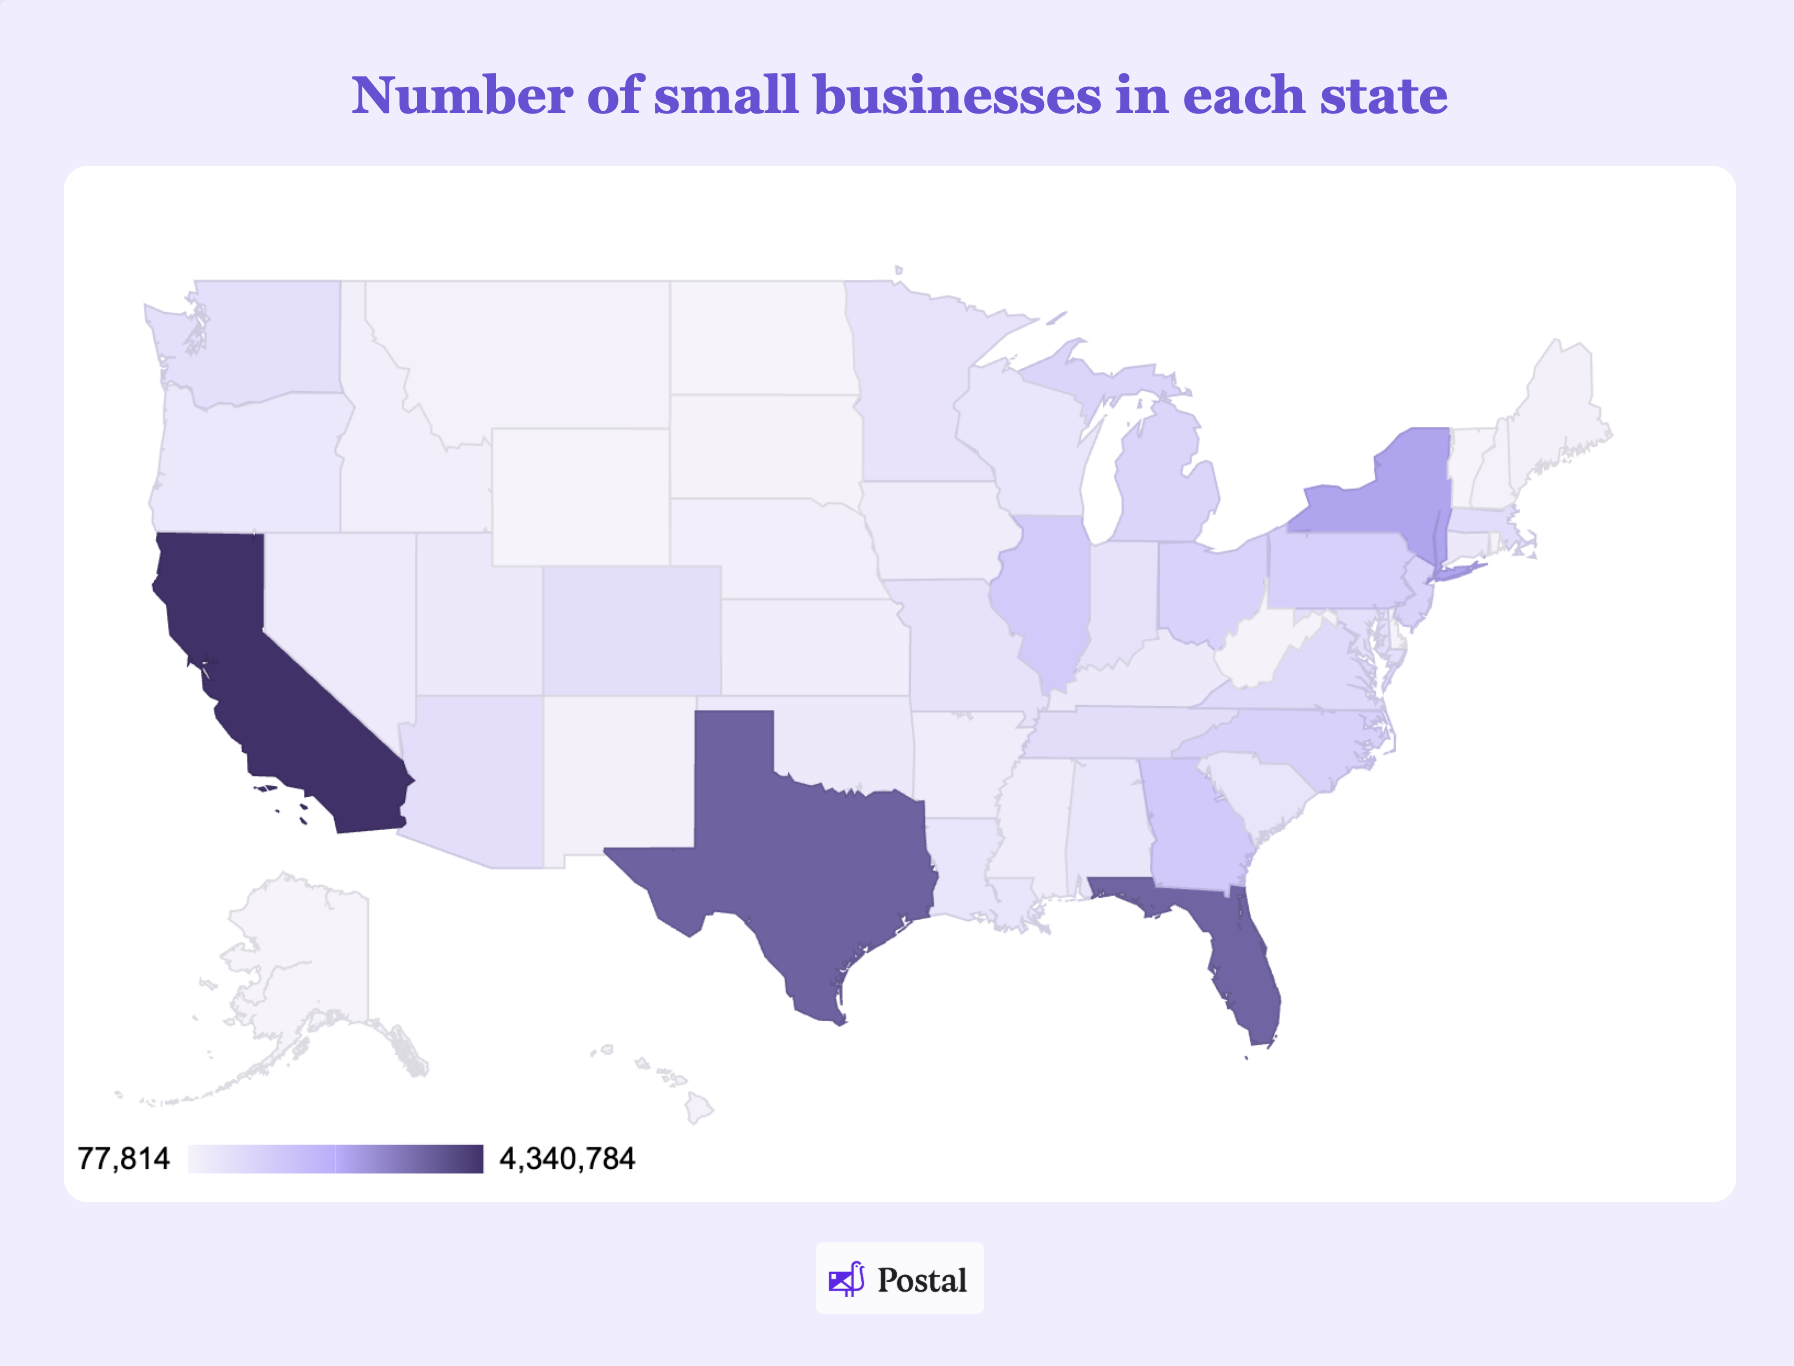
California, home to more small businesses than any other state, has over 4.3 million small businesses, of which 80.7% have no employees and 19.3% have recorded employees, as revealed by our analysis of Small Business Administration data.
Texas has the second most small businesses, with just over 3.5 million firms recorded and estimated to be operating in the ‘Lone Star State’, followed by Florida with just under 3.5 million.
New York has the fourth most small businesses, with almost 2.4 million small businesses recorded in the state.
Georgia ranks as the 5th most populous state for small businesses, with 1.4 million small businesses registered in the state.
Top 10 states with the most small businesses
Small business employment by state
Despite small businesses making up 99.9% of all businesses in the U.S., they account for just 45.9% of employment. This employment figure varies across states, ranging from 39.6% to 66.3%.
The following chart shows the share of employees in each state who work for a small business, highlighting the areas of the country where small businesses are the largest and smallest employers.
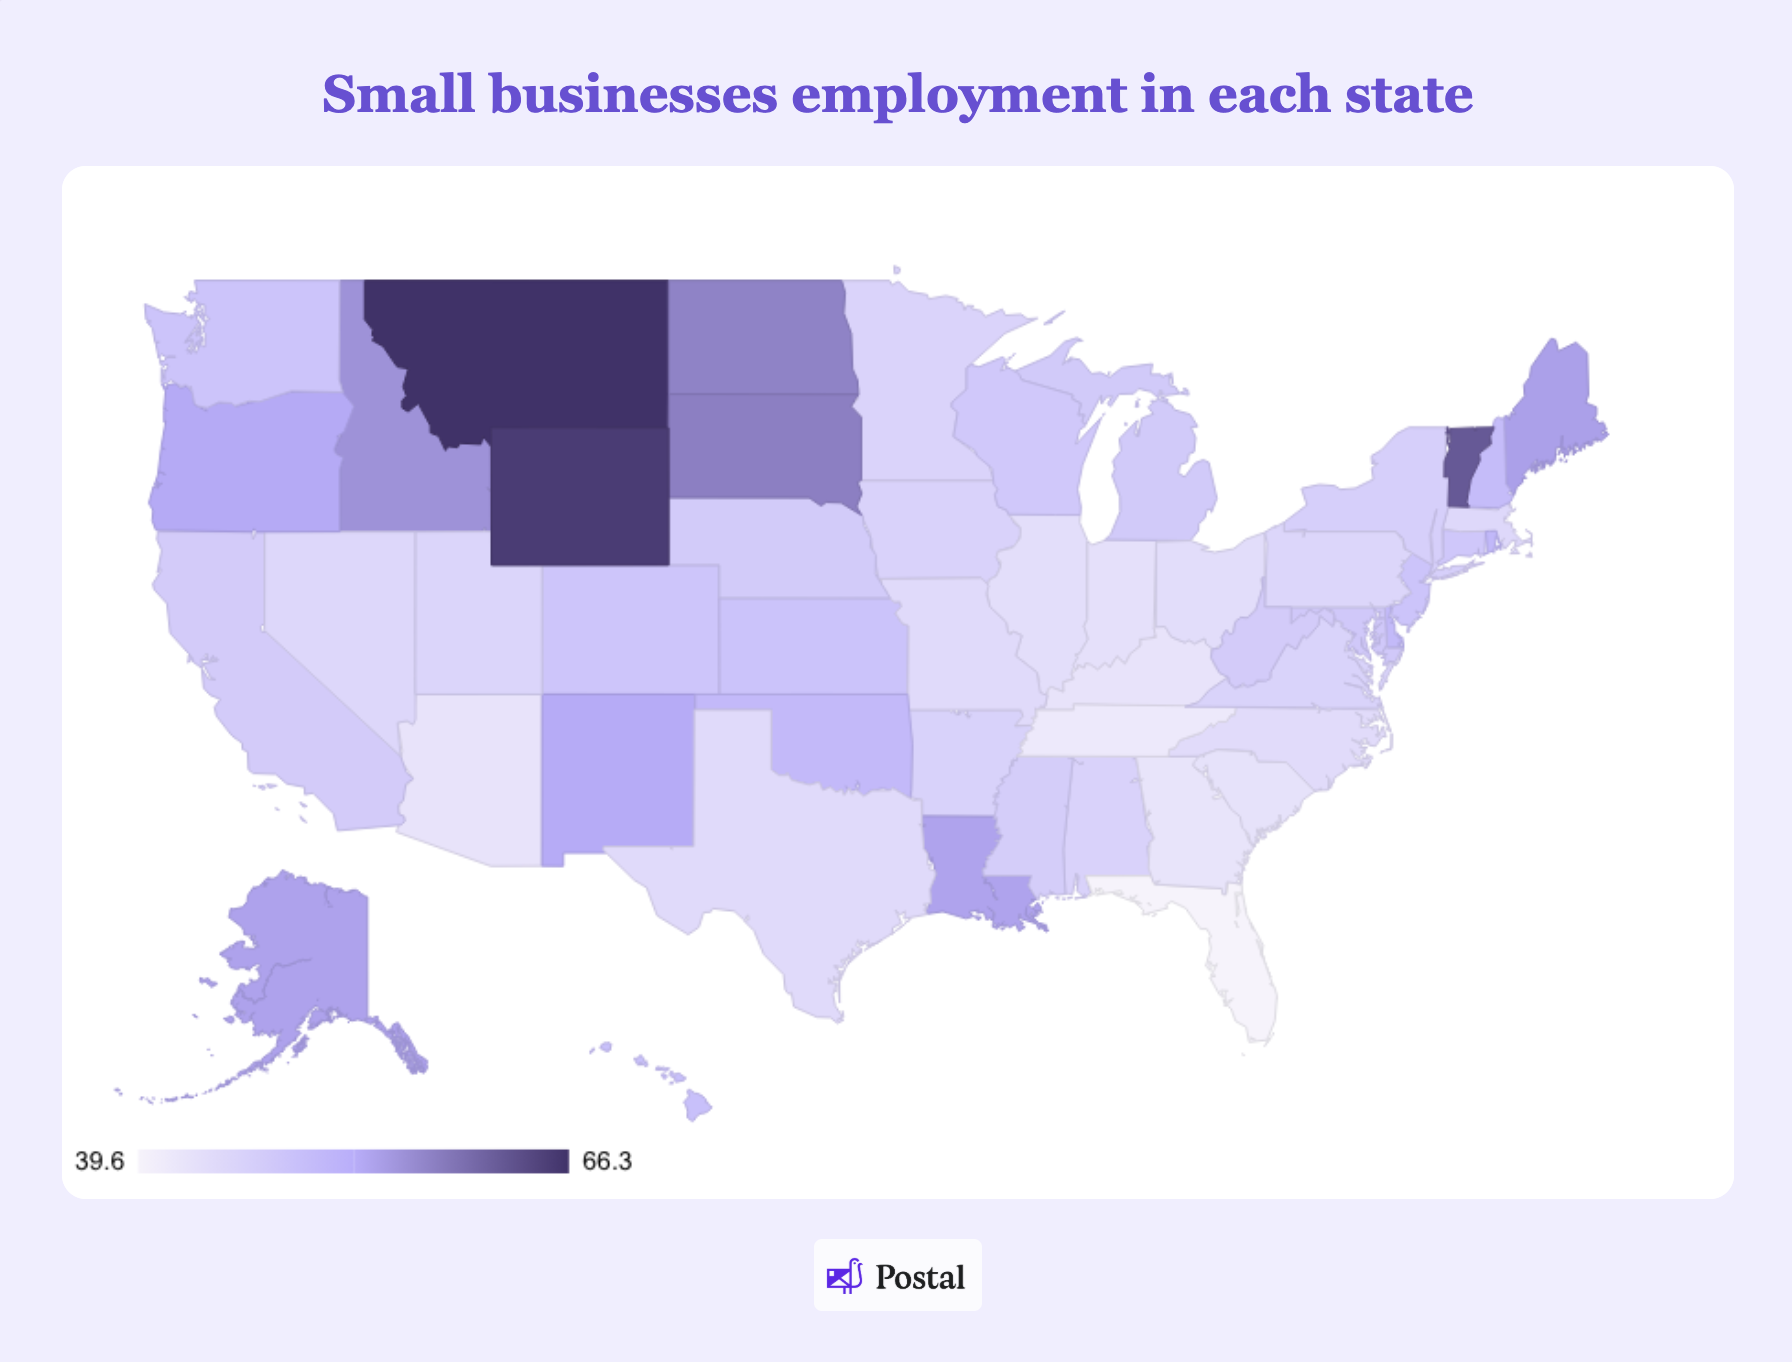
Numbers from the most recent (2025) Small Business Profiles for the States, by the Small Business Administration, reveal that Florida has the lowest share of employment from small businesses. Fewer than two-fifths (39.6%) of employees in the ‘Sunshine State’ work for a small business, compared to more than two-thirds in Montana (66.3%).
Among the states where small businesses account for the majority of employment, most are found in the Western interior region or among those with the lowest populations.
State where small businesses are the biggest employers
Employment percentages relative to overall employment help indicate where small businesses are most influential in local economies and communities. Our analysis of SBA data also revealed the areas where small businesses are most likely to be run by solo-entrepreneurs, freelancers, and independent contractors.
Our analysis found that of the over 32 million small businesses in the United States, just 17.6% have 1 or more employees. Of the 6,374,594 businesses reported as having employees, the vast majority have between 1 and 19 workers (5,720,093), while just over 10.3% have 20 to 499 workers.
Small businesses without any employees
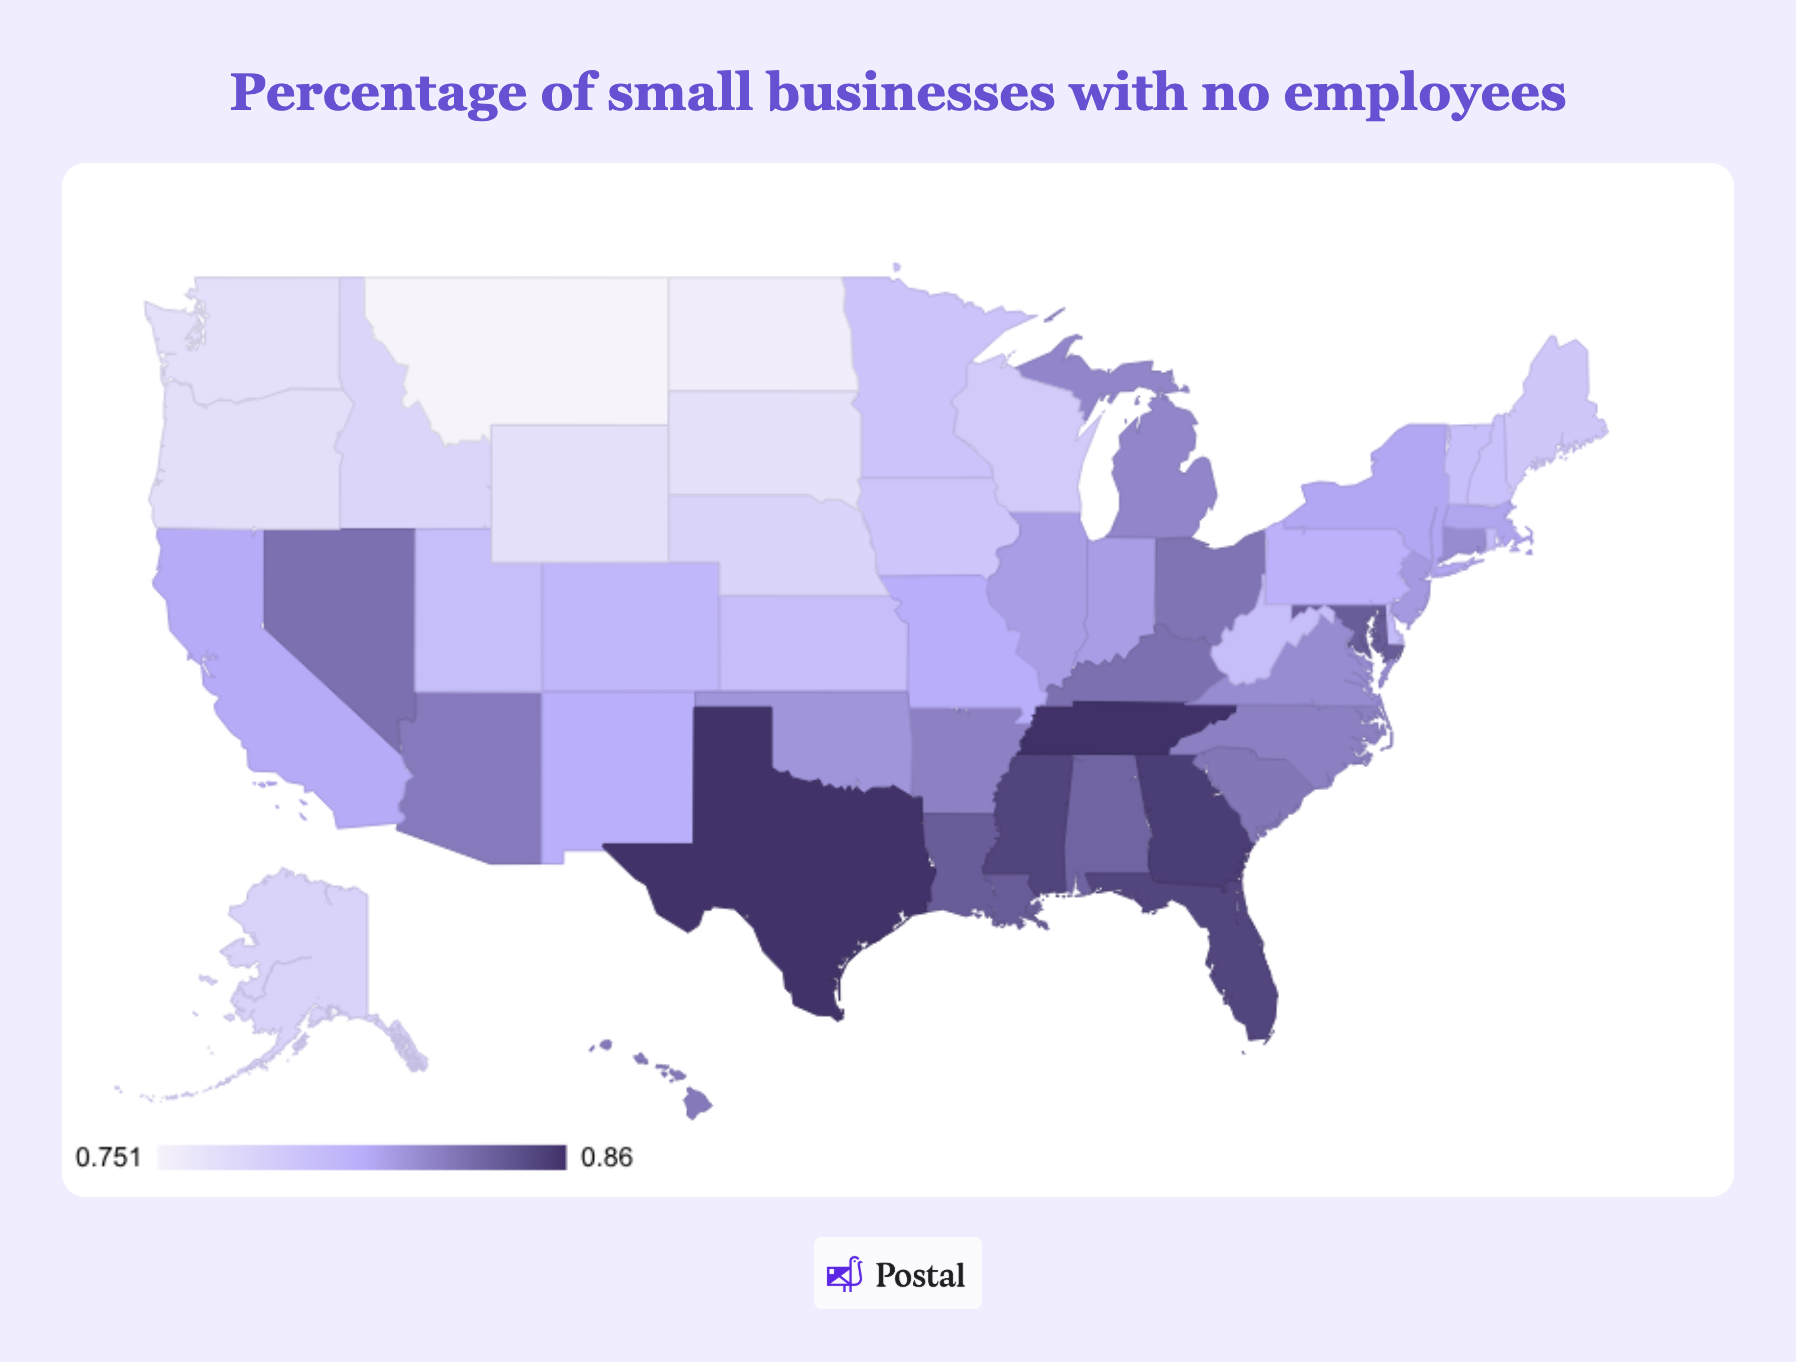
As the map above reveals, Tennessee, followed very closely by Texas, has the highest percentage of small businesses with no employees, run by freelancers, independent contractors, and solo-entrepreneurs.
Georgia and Mississippi are the states with the third- and fourth-most small businesses run without employees. Florida comes in fifth.
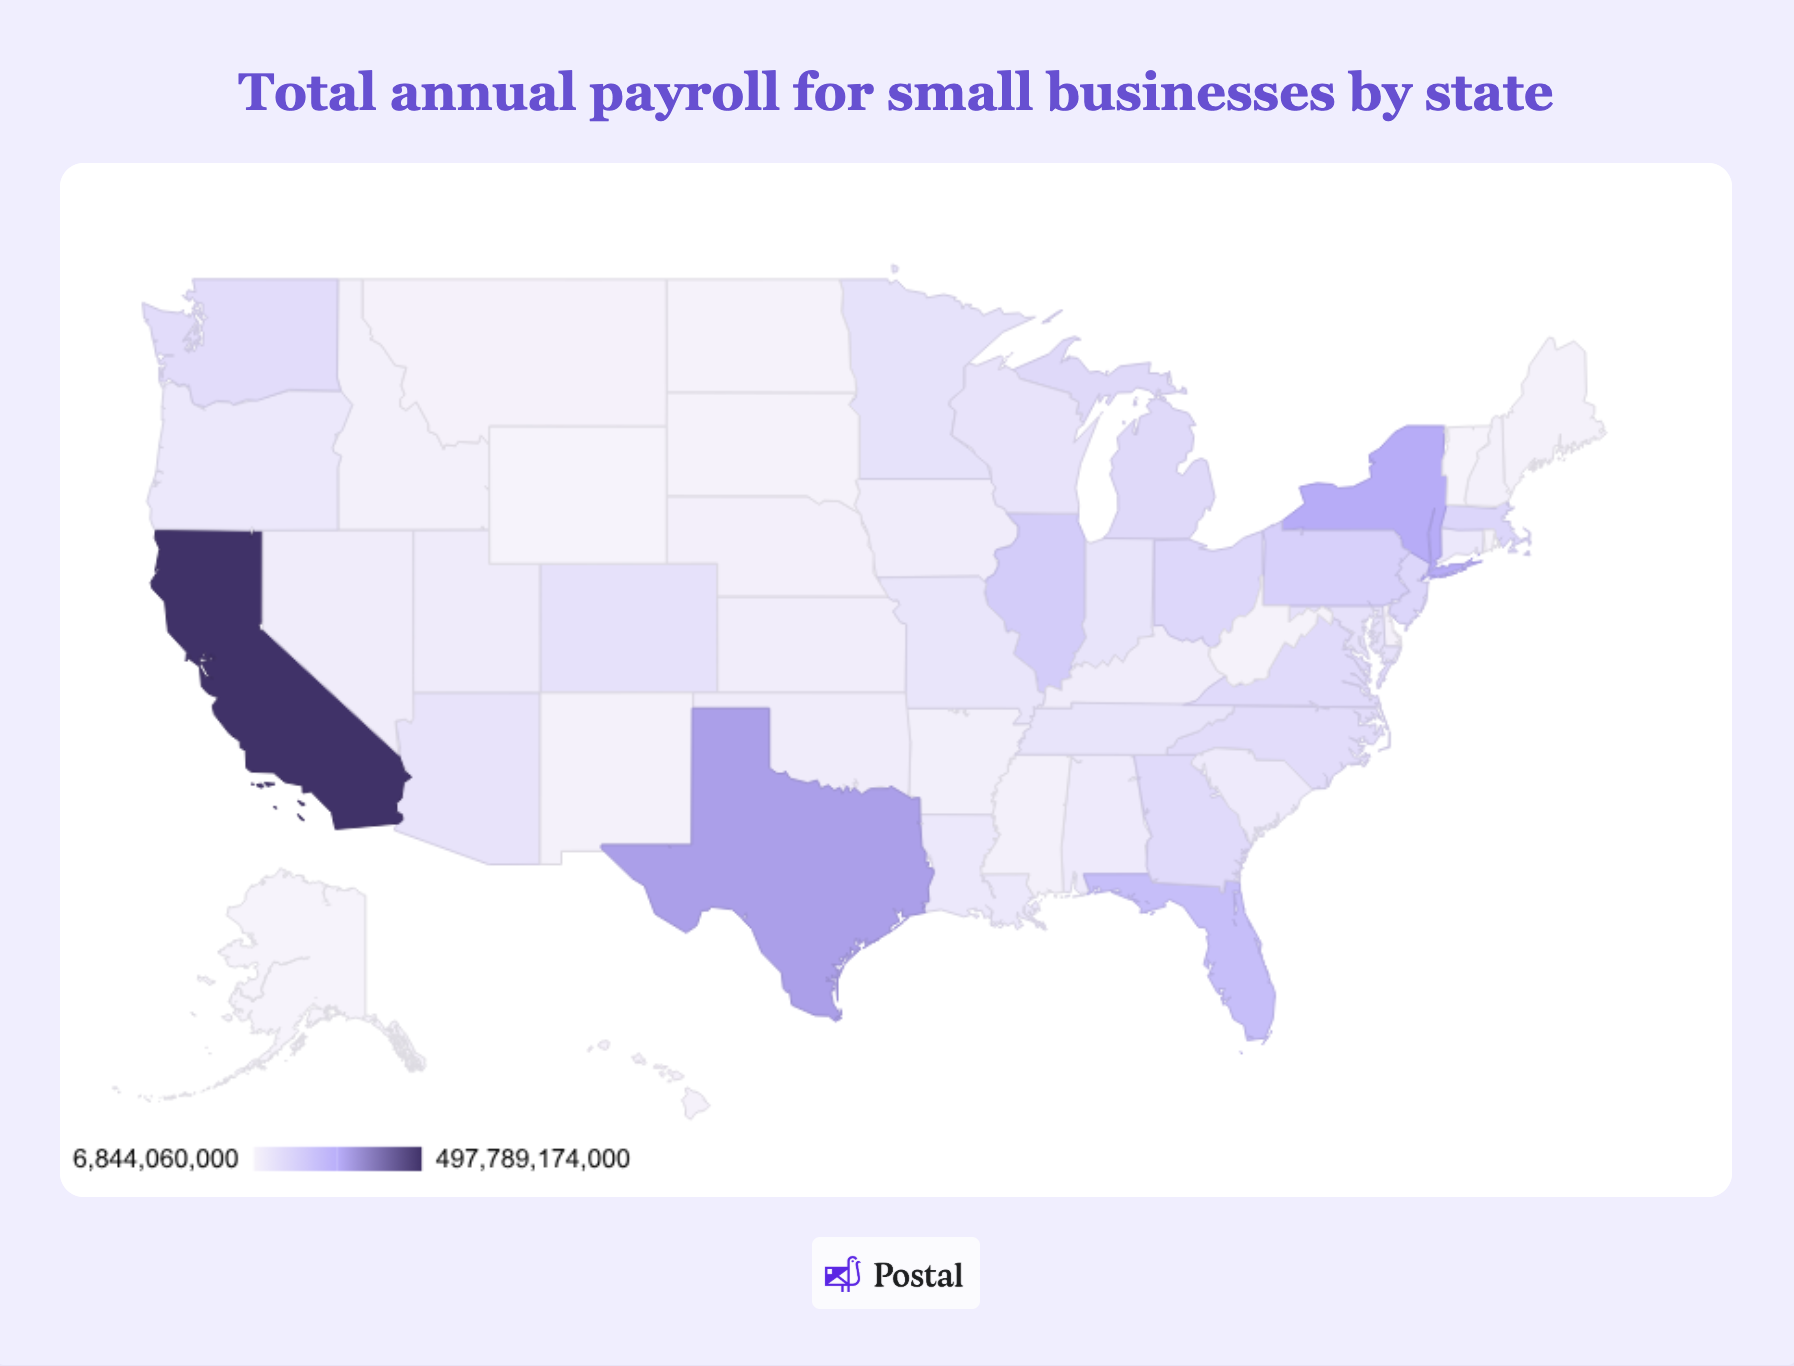
Payroll of small businesses by state
Employment by small businesses across the U.S. provides over $3.46 trillion dollars in payroll, accounting for a little under two-fifths of total payroll (38.7%). Per employee, our analysis found that the average worker in a small business earns $55,663 per year.
But that only tells half the story when it comes to average pay from small businesses. Our data shows that the average payroll per employee for small businesses ranges by $48,651. At the extremes, small businesses in Washington, DC report an average payroll of $89,712 per employee per annum, while those in Mississippi report an average of $41,061.
The map below shows the average payroll per employee, calculated by dividing total reported payroll by small-business employment figures in each state.
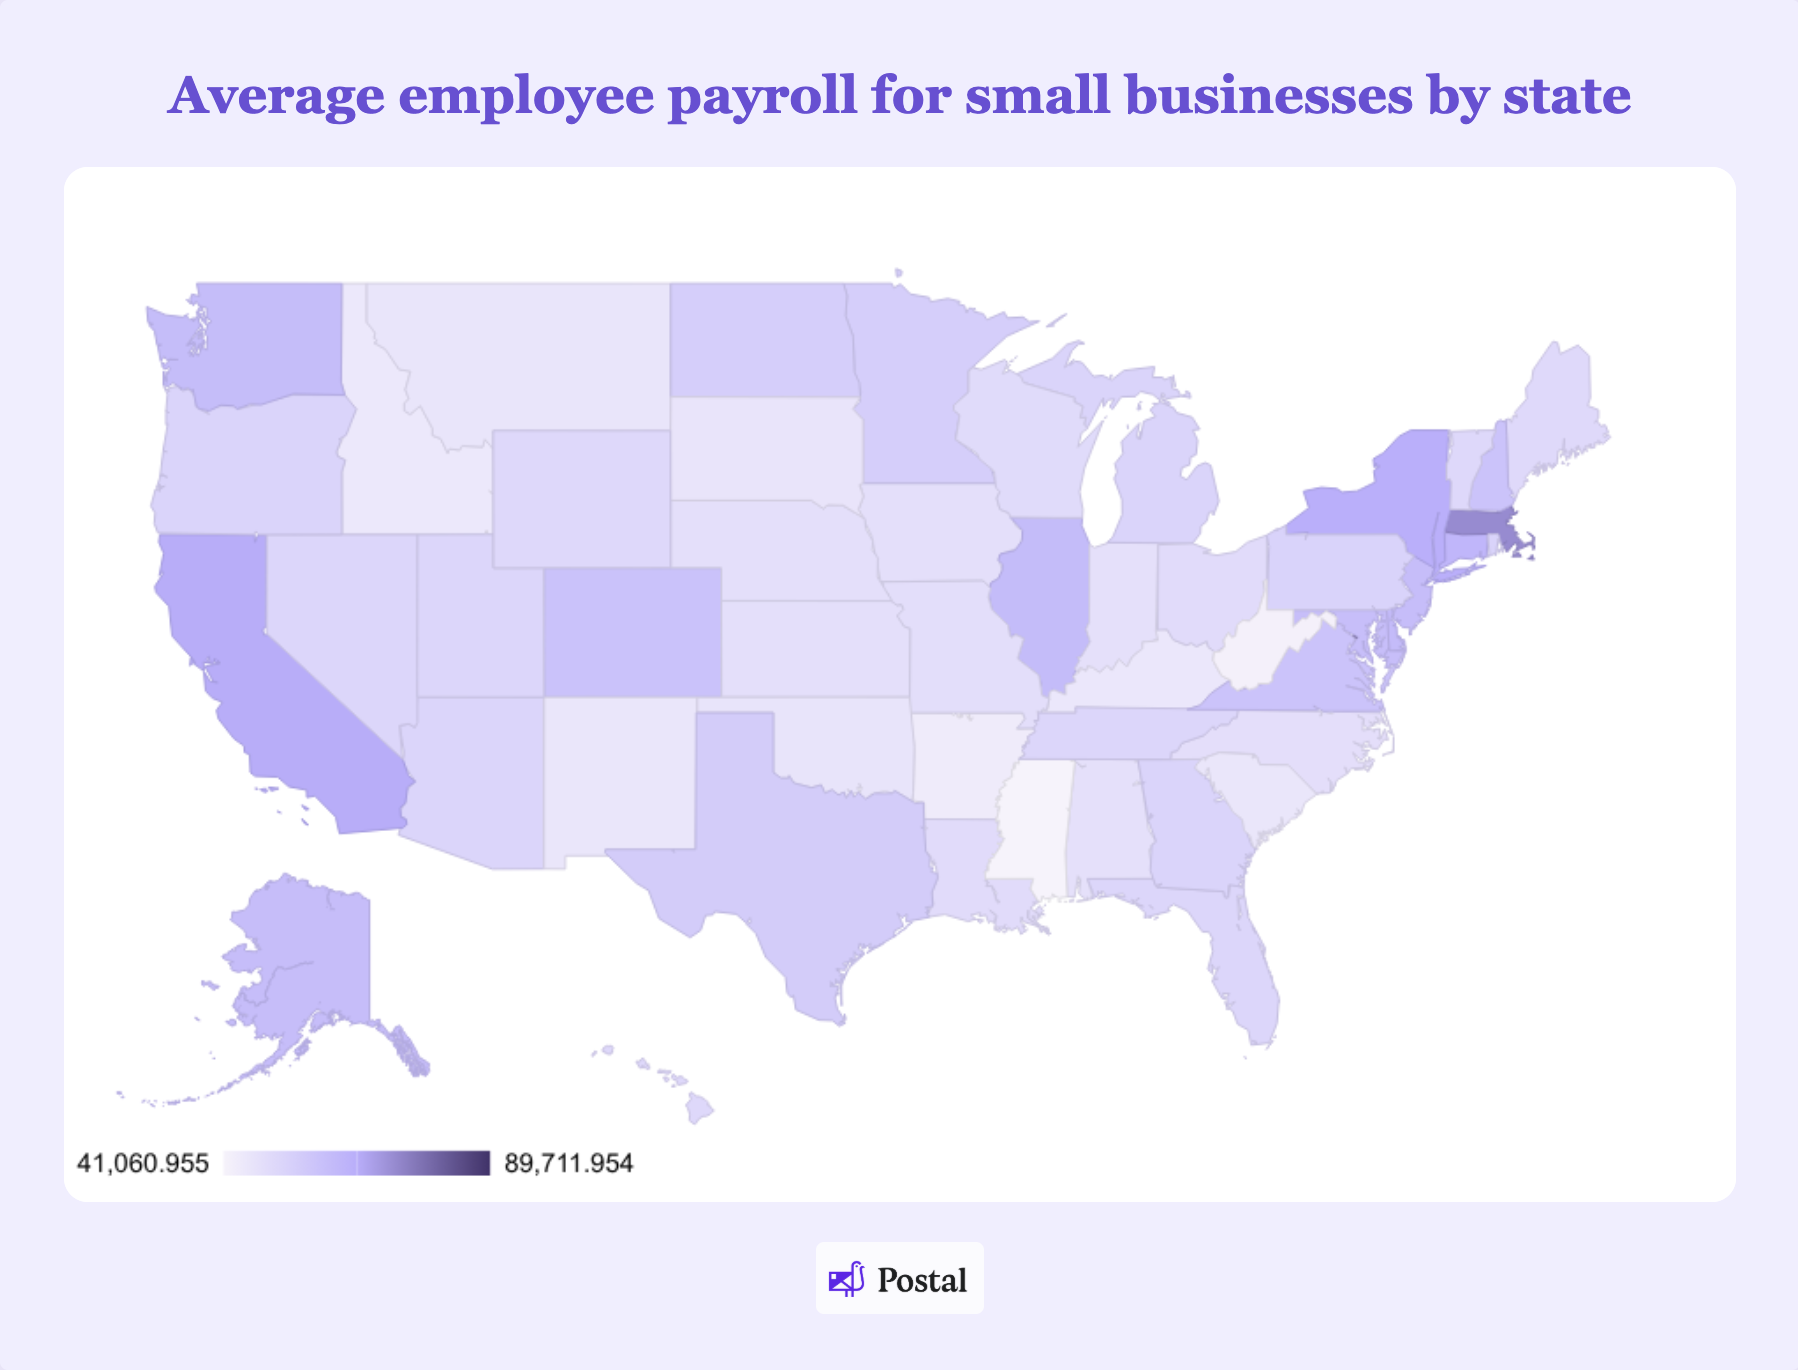
It’s worth noting that while Washington, DC has the highest average payroll per employee, it ranks 34th when looking at total payroll by small businesses by state.
Examining total payroll figures attributed to small businesses, our analysis found that California is the leading state. The ‘Golden State' attributes nearly half a trillion dollars ($498 billion) in payroll to small businesses, accounting for over 14% of the $3.46 trillion in small-business pay to employees annually.
Small businesses in Texas provide $281 billion in payroll, the second highest in the country. In the third spot, small businesses in New York account for $256 billion in payroll, helping local economies and communities thrive.
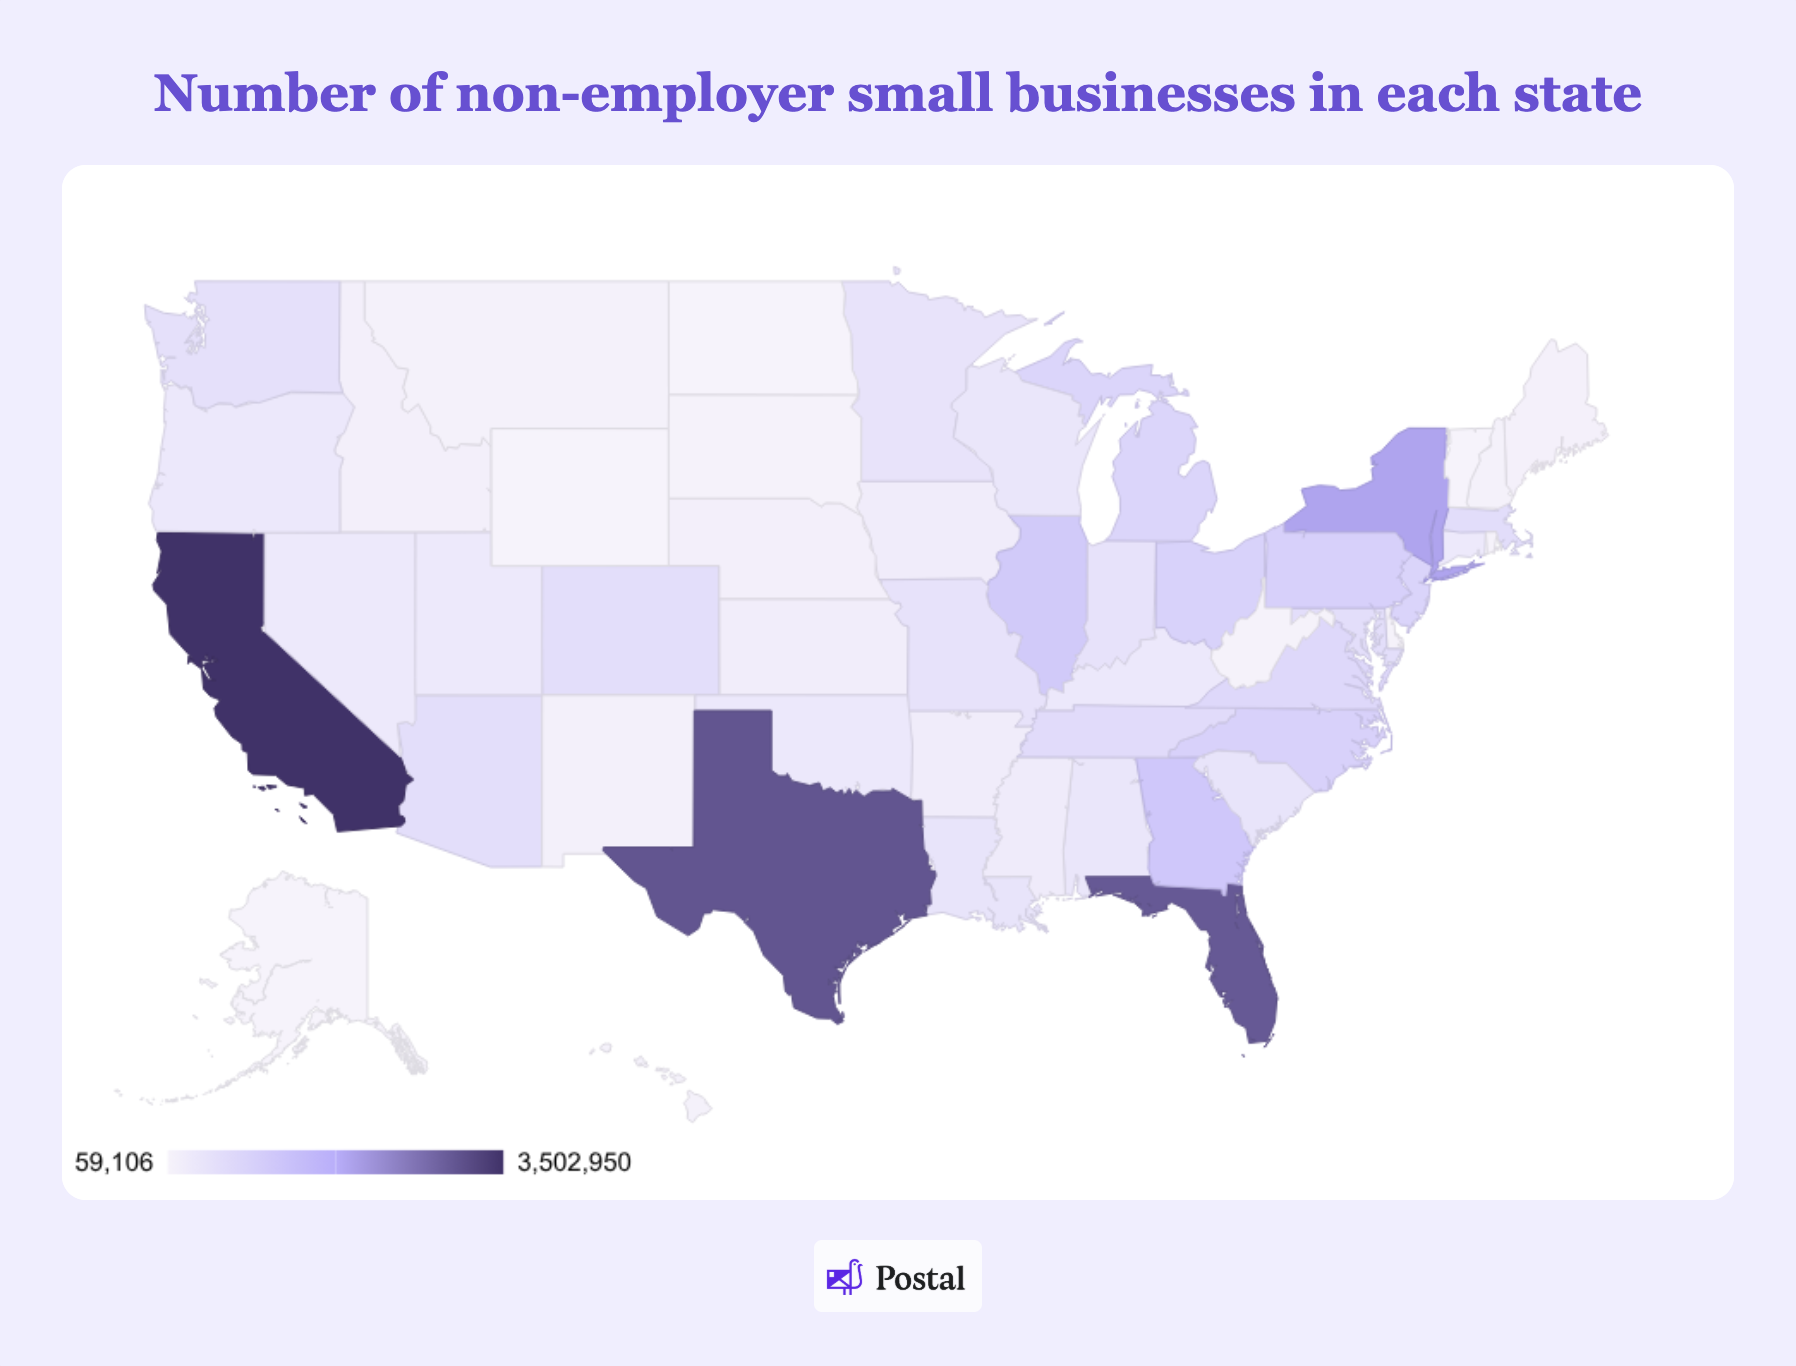
Zero-employee businesses by state
In all, 82.4% of small businesses in the US have zero employees, with 29.8 million of the 36.2 million recorded as having no employees in SBA data. These figures highlight the importance of and sheer volume of independent solo businesses, freelancers, and contractors to the U.S. economy, with the latest figures estimating they report over $1.7 trillion in income receipts.
The state with the highest number of zero-employee small businesses is California, where 3.5 million of the 4.3 million small businesses (80.7%) are recorded as having no employees. In Texas, home to the second-highest number of small businesses, 86% of small businesses have zero employees, with 3 million of the 3.5 million small businesses staff-less.
While more than 80% of U.S. small businesses don’t have any employees, in some states this figure is as high as 86%, while in others it is as low as 75%.
Texas and Tennessee have the highest percentages of small businesses with zero employees (86%), followed by Georgia (85.5%), Mississippi (85.2%), and Florida (85.1%).
At the other end of the spectrum, Montana has the highest share of small businesses with employees, with just 75.1% reporting no employees. North Dakota (75.6%) and South Dakota (76.6%) have the second- and third-lowest percentages of small businesses without employees.
The table below shows the breakdown of total small businesses and those reporting no employees.
Small businesses by metro area
To get a better idea of small businesses' capital, we also examined which Metro areas have the most small businesses and how they compare in terms of payroll and income receipts.
Analyzing the latest Census Bureau Statistics of U.S. Businesses (SUSB) data, we found that the New York, Newark, and Jersey City Metro Area is home to the most small businesses, with 484,447 employer small businesses, and a further 2.2 million registered as non-employer establishments.
This means that across all small businesses, the New York, Newark, and Jersey City Metro Area is home to almost 2.7 million small businesses (across the New York and New Jersey state lines).
The Los Angeles, Long Beach, and Anaheim Metro Area has the second most small businesses (1.8 million), of which over 352,000 have employees and 1.45 million are nonemployer businesses.
Miami, Fort Lauderdale, and West Palm Beach have the third-most small businesses, including employer firms and non-employer establishments (1.56 million); Chicago, Naperville, and Elgin, across the Illinois-Indiana state line, have the fourth-most (1.12 million).
The 10 Metro Areas with the most employer small firms and non-employee establishments
Across the 387 metro areas analyzed, non-employer establishments accounted for an average of 81% of small businesses, with more than 90% of small businesses in the McAllen, Edinburg, and Mission metro area having no employees.
Among major metro areas with half a million or more small businesses recorded, the Miami-Fort Lauderdale-West Palm Beach area has the highest percentage of non-employer businesses (87.8%).
Houston-Pasadena-The Woodlands had a non-employer percentage of 87.2%, while Dallas-Fort Worth-Arlington had 86%.
The percentage of small businesses that have no employees in major metro areas
Small business employment by metro area
Our analysis shows that across the 387 metro areas analyzed, there are over 5.7 million small employer businesses. The data show that the New York-Newark-Jersey City metro area is home to the highest number of these small businesses.
The New York-Newark-Jersey City metro area is home to 484,447 small businesses, representing 8.5% of the nation's small businesses, and employing over 4.1 million people (an average of 9 people per business) at over 500,000 establishments.
Los Angeles-Long Beach-Anaheim has the second-highest employment by small businesses, with almost 2.9 million jobs created by over 352,000 small businesses in the metro area. On average, small businesses in the Los Angeles-Long Beach-Anaheim metro area employ 8 people per business.
The metro area with the third-highest employment from small businesses is Chicago-Naperville-Elgin. More than 1.8 million people in the Chicago metro area are employed by small businesses, with over 200,000 firms employing an average of 9 people per firm.
The metro areas with the most employees working for small businesses
Payroll of small businesses by metro area per employee
On average across the metro areas analyzed, small businesses pay $57,412 per employee. However, those in the San Jose-Sunnyvale-Santa Clara metro area earn an average of $91,298, almost $34,000 more than the national ‘average’.
Figures show that there are just under 41,000 small businesses in the San Jose-Sunnyvale-Santa Clara metro area, employing a total of 424,355 people, or 10 people per firm. In all, firms in and around San Jose pay their employees a share of $38.7 billion per year, equivalent to 16.9% of income and revenue receipts.
Another California metro area ranks second for payroll among small businesses. Small businesses in San Francisco-Oakland-Fremont pay a total of $96.9 billion to their 1.1 million employees, or $87,990 per employee, the second highest among the areas analyzed. This also shows payroll as the 7th-highest relative to revenue (25.5%).
The third-highest paying metro area is Bridgeport-Stamford-Danbury. On average, the almost 205,000 employees of small businesses in the Bridgeport-Stamford-Danbury metro area earn $81,334 each. However, the $16.6 billion in payroll accounts for only 18.8% of the value of revenue receipts reported by small-business employers in the area.
The 20 metro areas with the highest average payroll per employee at a small business
Total payroll of small businesses by metro area
While average payroll per employee offers insight into the areas with the highest wages among small employers, rankings don’t necessarily reflect the areas that pay the most, due to both the number of firms and employees.
New York-Newark-Jersey City has by far the highest total payroll of any area analyzed. Over 4.1 million people are employed by small businesses; over 1.2 million more than any other metro area. Annually, records show that small businesses in the New York-Newark-Jersey City metro area pay over $282.4 billion in wages to their employees, at an average rate of $68,525.
Compared with total revenues and income receipts, this payroll figure accounts for 19.9% of the small businesses' total. In comparison, the national average is 19.7%.
Los Angeles-Long Beach-Anaheim has the second-highest total payroll figure. In all, small businesses spend almost $188.7 billion on payroll each year. Analysis showed that, on average, the nearly 2.9 million employees of small businesses in the Los Angeles-Long Beach-Anaheim metro area earn $65,712.
The metro area with the third-highest payroll by small businesses is Chicago-Naperville-Elgin. Annual data showed that small businesses pay out 19.4% of their revenue to employees, totaling $121.6 billion. Among the over 1.8 million small-business employees in Chicago and the surrounding metro area, the average payroll is $65,281.
The 20 metro areas where small businesses record the highest payroll in total
Earnings of small businesses by metro area
Our analysis showed that across the 387 metro areas analyzed, small businesses earned a combined $15.9 trillion dollars. In comparison, large businesses across the same metro areas earn almost $28.7 trillion dollars.
The New York-Newark-Jersey City metro area has the highest earnings of all the metro areas. More than $1.4 trillion in revenue and income receipts is reported to have been earned by the over 484,000 small businesses in the metro area, meaning the average small business earns over $2.9 million.
Los Angeles-Long Beach-Anaheim records the second-highest earnings among small businesses. In total, small businesses in and around Los Angeles generate over $970 billion in sales, revenue, and income, averaging $2,755,969 per small business.
Houston-Pasadena-The Woodlands has the third-highest revenues reported. Figures showed that the 123,315 firms in the metro area earn almost $691 billion in revenue, at a rate of $5.6 million per small business - the third highest in the analysis, behind only Midland ($6.5 million) and San Jose-Sunnyvale-Santa Clara ($5.62 million).
The metro areas with the highest earnings reported in their annual receipts
Methodology
We analyzed data on small businesses from the latest U.S. Small Business Administration - Office of Advocacy and the Census Bureau’s Statistics of U.S. Businesses (SUSB), examining the number of small businesses in each state and metro area, as well as income, payroll, and employment figures.
During our analysis, we calculated the average payroll per employee to reveal the average annual pay for workers in small businesses across the US, as well as the percentage of total businesses that have employees compared to non-employee establishments.
Our analysis aimed to reveal the areas of the U.S. where small businesses are most prominent and just how much they impact and support local economies and communities.
Sources:
Small and Micro Business definition: (accessed 04/27/2026)
State Small Business Profiles: (accessed 04/22/2026)
Statistics of U.S. Businesses (SUSB), annual or static data, localized firm and establishment data: (accessed 04/22/2026)
https://www.census.gov/data/tables/2022/econ/susb/2022-susb-annual.html
Census Bureau Nonemployer Statistics by Legal Form of Organization and Receipts Size Class for the U.S., States, and Selected Geographies: (accessed 04/27/2026)
Mail management and daily compliance done for you
Say goodbye to lost mail and missed deadlines. Postal is the virtual mailbox that actions your daily compliance mail for you.

Max studied History at Northwestern and Law at the University of Michigan. He spent 4 years practicing law (M&A and insurance regulatory work) before moving to Palantir, where he led business development efforts and implementation teams at the DoD and federal civilian agencies. Max is the CEO and co-founder of Postal, a YC-backed SaaS company.
AI mail management that keeps your business compliant